|
|
Stewart's Corral |
Page 22
visitor # |
|
Climate data for Lambert Creek, Republic, WA Elevation 2815 ft. (858 m) | |||||||||||||
| Month | Jan | Feb | Mar | Apr | May | Jun | Jul | Aug | Sep | Oct | Nov | Dec | Year |
|---|---|---|---|---|---|---|---|---|---|---|---|---|---|
| Record high °F (°C) | 52.7 (11.5) |
59.6 (15.3) |
73.3 (22.9) |
90.2 (32.3) |
100.1 (37.8) |
117.2 (47.3) |
110.0 (43.3) |
107.6 (42.0) |
101.7 (38.7) |
88.0 (31.1) |
61.6 (16.4) |
52.0 (11.1) |
117.2 (47.3) |
| Record low °F (°C) | -22.7 (-30.4) |
-19.9 (-28.8) |
-9.2 (-22.9) |
11.0 (-11.7) |
17.5 (-8.1) |
26.8 (-2.9) |
32.0 ( 0.0) |
31.3 (-0.4) |
23.2 (-4.9) |
4.5 (-15.3) |
-17.9 (-27.7) |
-21.3 (-29.6) |
-22.7 (-30.4) |
| Average high °F (°C) | 33.0 ( 0.6) |
40.8 ( 4.9) |
50.6 (10.3) |
61.6 (16.4) |
72.4 (22.4) |
79.7 (26.5) |
91.9 (33.3) |
89.1 (31.7) |
77.5 (25.3) |
58.8 (14.9) |
39.3 ( 4.1) |
31.6 (-0.2) |
60.5 (15.8) |
| Average low °F (°C) | 16.4 (-8.7) |
18.1 (-7.7) |
24.7 (-4.1) |
29.2 (-1.6) |
36.1 ( 2.3) |
42.7 ( 5.9) |
47.1 ( 8.4) |
45.6 ( 7.6) |
38.8 ( 3.8) |
30.7 (-0.7) |
23.2 (-4.9) |
16.7 (-8.5) |
30.8 (-0.7) |
| Average precipitation inches (mm) |
1.59 (40) |
1.06 (27) |
1.61 (41) |
1.63 (41) |
2.35 (60) |
2.60 (66) |
1.06 (27) |
1.06 (27) |
1.10 (28) |
1.44 (36) |
1.94 (49) |
2.20 (56) |
19.63 (498) |
| Average snowfall inches (cm) |
13.4 (34) |
7.9 (20) |
5.8 (15) |
2.4 (6) |
0.3 (1) |
0 (0) |
0 (0) |
0 (0) |
0 (0) |
0.7 (2) |
9.1 (23) |
16.3 (41) |
55.8 (142) |
| Average snowy days (≥0.1 in.) (≥0.25 cm) |
10.6 | 6.9 | 5.9 | 2.3 | 0.4 | 0 | 0 | 0 | 0 | 0.5 | 6.9 | 10.9 | 3.7 |
| Average high °F (°C) | 34.2 ( 1.2) |
47.0 ( 8.3) |
57.9 (14.4) |
65.7 (18.7) |
80.2 (26.8) |
91.3 (32.9) |
94.8 (34.9) |
88.8 (31.5) |
75.4 (24.1) |
65.7 (18.7) |
41.0 ( 5.0) |
34.2 ( 1.2) |
64.7 (18.2) |
| Average low °F (°C) | 21.3 (-5.9) |
25.7 (-3.5) |
28.9 (-1.7) |
28.8 (-1.8) |
38.4 ( 3.6) |
46.6 ( 8.1) |
49.2 ( 9.6) |
47.1 ( 8.4) |
37.2 ( 2.9) |
34.2 ( 1.2) |
21.0 (-6.1) |
20.7 (-6.3) |
33.3 ( 0.7) |
| Precipitation inches (mm) |
1.54 (39) |
1.73 (44) |
2.57 (65) |
0.95 (24) |
1.52 (39) |
1.96 (50) |
0.27 ( 7) |
0.51 ( 13) |
0.43 (11) |
1.14 (29) |
1.47 (37) |
4.38 (111) |
18.47 (469) |
| Snowfall inches (cm) |
15.0 (38) |
7.9 (20) |
3.1 (8) |
0.6 (1) |
0 (0) |
0 (0) |
0 (0) |
0 (0) |
0 (0) |
0 (0) |
6.9 (17) |
23.3 (59) |
56.8 (144) |
| Snowy days (≥0.1 in.) (≥0.25 cm) |
7 | 4 | 1 | 2 | 0 | 0 | 0 | 0 | 0 | 0 | 6 | 17 | 3.1 |
| Average high °F (°C) | 33.1 ( 0.6) |
41.3 ( 5.2) |
51.1 (10.6) |
61.9 (16.6) |
72.9 (22.7) |
80.5 (26.9) |
92.1 (33.4) |
89.1 (31.7) |
77.3 (25.2) |
59.2 (15.1) |
39.5 ( 4.1) |
31.8 (-0.1) |
60.8 (16.0) |
| Average low °F (°C) | 16.8 (-8.5) |
18.7 (-7.4) |
25.0 (-3.9) |
29.2 (-1.6) |
36.3 ( 2.4) |
43.0 ( 6.1) |
47.2 ( 8.5) |
45.7 ( 7.6) |
38.7 ( 3.7) |
30.9 (-0.6) |
23.1 (-5.0) |
17.0 (-8.3) |
31.0 (-0.6) |
| Average precipitation inches (mm) |
1.58 (40) |
1.11 (28) |
1.68 (43) |
1.58 (40) |
2.29 (58) |
2.55 (65) |
1.00 (25) |
1.02 (26) |
1.06 (27) |
1.42 (36) |
1.90 (48) |
2.35 (60) |
19.55 (496) |
| Average snowfall inches (cm) |
13.5 (34) |
7.9 (20) |
5.9 (15) |
2.2 (5) |
0.3 (1) |
0 (0) |
0 (0) |
0 (0) |
0 (0) |
0.6 (2) |
8.3 (21) |
16.8 (43) |
55.5 (141) |
| Average snowy days (≥0.1 in.) (≥0.25 cm) |
10.3 | 6.7 | 5.5 | 2.3 | 0.4 | 0 | 0 | 0 | 0 | 0.5 | 6.8 | 11.4 | 3.7 |
| Average high °F (°C) | 35.7 ( 2.1) |
44.4 ( 6.9) |
55.8 (13.2) |
74.2 (23.4) |
77.5 (25.3) |
82.9 (28.3) |
87.5 (30.8) |
90.9 (32.7) |
75.7 (24.3) |
55.0 (12.8) |
45.8 ( 7.7) |
26.0 (-3.3) |
62.8 (17.1) |
| Average low °F (°C) | 22.2 (-5.4) |
23.5 (-4.7) |
27.3 (-2.6) |
34.4 (1.3) |
38.7 (3.7) |
42.9 ( 6.0) |
45.7 ( 7.6) |
44.3 ( 6.8) |
37.3 ( 2.9) |
33.7 ( 1.0) |
30.9 (-0.6) |
10.1 (-12.2) |
32.6 ( 0.3) |
| Precipitation inches (mm) |
2.19 (56) |
1.41 (36) |
3.00 (76) |
1.48 (38) |
2.26 (57) |
1.85 (47) |
1.04 (26) |
0.30 ( 8) |
0.61 (15) |
4.84 (123) |
2.56 (65) |
1.06 (27) |
22.60 (574) |
| Snowfall inches (cm) |
19.1 (48) |
2.1 (5) |
4.1 (10) |
0.0 (0) |
0.0 (0) |
0.0 (0) |
0.0 (0) |
0.0 (0) |
0.0 (0) |
0.0 (0) |
2.9 (7) |
11.8 (30) |
40.0 (102) |
| Snowy days (≥0.1 in.) (≥0.25 cm) |
12 | 2 | 5 | 0 | 0 | 0 | 0 | 0 | 0 | 0 | 4 | 9 | 2.7 |
| Average high °F (°C) | 27.6 (-2.5) |
36.3 ( 2.4) |
48.6 ( 9.2) |
59.3 (15.2) |
75.0 (23.9) |
84.5 (29.2) |
96.9 (36.0) |
95.1 (35.0) |
79.3 (26.3) |
58.9 (15.0) |
39.2 ( 4.0) |
28.0 (-2.2) |
60.9 (16.1) |
| Average low °F (°C) | 9.4 (-12.5) |
14.5 (-9.7) |
26.0 (-3.4) |
29.6 (-1.3) |
38.1 ( 3.4) |
42.3 ( 5.7) |
45.9 ( 7.7) |
46.3 ( 7.9) |
38.8 ( 3.8) |
27.6 (-2.5) |
25.8 (-3.5) |
12.8 (-10.6) |
29.8 (-1.2) |
| Precipitation inches (mm) |
1.37 (35) |
3.12 (79) |
2.32 (59) |
3.28 (83) |
3.66 (93) |
0.43 (11) |
0.00 (0) |
0.00 (0) |
0.29 (7) |
1.14 (29) |
2.87 (73) |
1.43 (36) |
19.91 (506) |
| Snowfall inches (cm) |
13.7 (35) |
19.1 (48) |
6.4 (16) |
0.0 (0) |
0.0 (0) |
0.0 (0) |
0.0 (0) |
0.0 (0) |
0.0 (0) |
0.7 (2) |
15.4 (39) |
16.8 (43) |
72.0 (183) |
| Snowy days (≥0.1 in.) (≥0.25 cm) |
7 | 11 | 4 | 0 | 0 | 0 | 0 | 0 | 0 | 1 | 12 | 10 | 3.8 |
| Average high °F (°C) | 36.9 ( 2.7) |
38.2 ( 3.5) |
49.8 ( 9.9) |
60.1 (15.6) |
82.0 (27.8) |
81.3 (27.4) |
95.0 (35.0) |
90.8 (32.7) |
74.5 (23.6) |
60.3 (15.7) |
41.6 ( 5.3) |
33.8 ( 1.0) |
62.2 (16.8) |
| Average low °F (°C) | 21.5 (-5.8) |
12.5 (-10.9) |
24.2 (-4.3) |
30.1 (-1.1) |
41.8 ( 5.5) |
41.2 ( 5.1) |
46.5 ( 8.1) |
45.9 ( 7.7) |
37.8 ( 3.2) |
29.1 (-1.6) |
24.4 (-4.2) |
20.2 (-6.5) |
31.4 (-0.3) |
| Precipitation inches (mm) |
3.60 (91) |
1.77 (45) |
2.68 (68) |
2.16 (55) |
0.94 (24) |
1.38 (35) |
0.08 (2) |
0.16 (4) |
0.88 (22) |
1.39 (35) |
1.43 (36) |
2.00 (51) |
18.47 (469) |
| Snowfall inches (cm) |
25.0 (64) |
16.6 (42) |
21.3 (54) |
0.6 (2) |
0.0 (0) |
0.0 (0) |
0.0 (0) |
0.0 (0) |
0.0 (0) |
0.0 (0) |
3.4 (9) |
15.0 (38) |
81.9 (208) |
| Snowy days (≥0.1 in.) (≥0.25 cm) |
13 | 9 | 5 | 2 | 0 | 0 | 0 | 0 | 0 | 0 | 5 | 7 | 3.4 |
| Average high °F (°C) | 35.2 ( 1.8) |
31.4 (-0.3) |
50.1 (10.1) |
61.8 (16.5) |
77.4 (25.2) |
83.0 (28.3) |
88.0 (31.1) |
90.4 (32.4) |
70.6 (21.5) |
53.6 (12.0) |
41.6 ( 5.3) |
33.3 ( 0.7) |
59.9 (15.5) |
| Average low °F (°C) | 18.5 (-7.5) |
9.1 (-12.7) |
17.8 (-7.9) |
29.1 (-1.2) |
38.1 (3.4) |
41.1 (5.1) |
46.4 (8.0) |
47.3 (8.5) |
42.9 (6.0) |
26.9 (-2.8) |
22.1 (-5.5) |
22.5 (-5.3) |
30.3 (-0.9) |
| Precipitation inches (mm) |
1.28 (33) |
1.52 (39) |
0.61 (15) |
1.24 (31) |
2.10 (53) |
0.48 (12) |
0.48 (12) |
0.97 (25) |
3.79 (96) |
0.81 (21) |
0.60 (15) |
1.09 (28) |
14.97 (380) |
| Snowfall inches (cm) |
10.6 (27) |
20.1 (51) |
4.3 (11) |
0.0 (0) |
0.0 (0) |
0.0 (0) |
0.0 (0) |
0.0 (0) |
5.0 (13) |
0.2 (1) |
0.1 (0) |
13.1 (33) |
53.5 (136) |
| Snowy days (≥0.1 in.) (≥0.25 cm) |
8 | 11 | 3 | 0 | 0 | 0 | 0 | 0 | 1 | 1 | 1 | 11 | 3.0 |
| Average high °F (°C) | 35.8 ( 2.1) |
42.1 ( 5.6) |
50.8 (10.4) |
63.8 (17.7) |
70.7 (21.5) |
78.8 (26.0) |
89.8 (32.1) |
91.4 (33.0) |
81.8 (27.7) |
58.5 (14.7) |
41.4 ( 5.2) |
33.3 ( 0.7) |
61.6 (16.4) |
| Average low °F (°C) | 21.1 (-6.1) |
18.5 (-7.5) |
22.1 (-5.5) |
27.1 (-2.7) |
38.8 ( 3.8) |
43.7 ( 6.5) |
45.5 ( 7.5) |
45.6 ( 7.6) |
40.8 ( 4.9) |
30.6 (-0.8) |
23.3 (-4.9) |
19.5 (- 6.9) |
31.4 (-0.3) |
| Precipitation inches (mm) |
2.53 (64) |
1.01 (26) |
0.83 (21) |
0.13 ( 3) |
6.65 (169) |
3.38 (86) |
0.90 (23) |
0.26 ( 7) |
0.70 (18) |
1.96 (50) |
1.50 (38) |
1.61 (41) |
21.46 (545) |
| Snowfall inches (cm) |
24.1 (61) |
14.2 (36) |
2.6 ( 7) |
0.6 ( 1) |
0.0 ( 0) |
0.0 ( 0) |
0.0 ( 0) |
0.0 ( 0) |
0.0 ( 0) |
10.6 (27) |
14.6 (37) |
13.9 (35) |
80.6 (205) |
| Snowy days (≥0.1 in.) (≥0.25 cm) |
15 | 4 | 7 | 1 | 0 | 0 | 0 | 0 | 0 | 3 | 9 | 8 | 3.9 |
| Average high °F (°C) | 36.6 ( 2.6) |
37.8 ( 3.2) |
54.9 (12.7) |
66.1 (18.9) |
76.1 (24.5) |
90.4 (32.4) |
99.8 (37.7) |
86.8 (30.5) |
75.5 (24.2) |
57.4 (14.1) |
42.5 ( 5.9) |
28.4 (-2.0) |
62.8 (17.1) |
| Average low °F (°C) | 21.0 (-6.1) |
14.9 (-9.5) |
22.9 (-5.0) |
27.8 (-2.4) |
34.1 ( 1.2) |
46.2 ( 7.9) |
50.9 (10.5) |
48.2 ( 9.0) |
39.8 ( 4.3) |
31.6 (-0.2) |
26.6 (-3.0) |
11.6 (-11.3) |
31.4 (-0.3) |
| Precipitation inches (mm) |
3.53 (90) |
1.47 (37) |
0.18 ( 5) |
0.88 (22) |
0.57 (14) |
1.63 (41) |
0.17 ( 4) |
0.51 (13) |
2.36 (60) |
2.08 (53) |
2.26 (57) |
2.38 (60) |
18.02 (458) |
| Snowfall inches (cm) |
23.4 (60) |
12.9 (33) |
0.2 ( 0) |
0.0 ( 0) |
0.0 ( 0) |
0.0 ( 0) |
0.0 ( 0) |
0.0 ( 0) |
0.0 ( 0) |
0.1 ( 0) |
9.6 (24) |
24.6 (62) |
70.8 (180) |
| Snowy days (≥0.1 in.) (≥0.25 cm) |
12 | 9 | 1 | 0 | 0 | 0 | 0 | 0 | 0 | 0 | 7 | 16 | 3.8 |
| Average high °F (°C) | 33.7 ( 0.9) |
40.0 ( 4.5) |
52.4 (11.3) |
57.0 (13.9) |
67.4 (19.7) |
78.5 (25.8) |
93.8 (34.3) |
96.2 (35.6) |
81.9 (27.7) |
68.7 (20.4) |
33.7 ( 1.0) |
26.8 (-2.9) |
61.0 (16.1) |
| Average low °F (°C) | 16.9 ( -8.4) |
14.2 ( -9.9) |
26.4 ( -3.1) |
25.6 ( -3.6) |
36.0 ( 2.2) |
43.9 ( 6.6) |
48.2 ( 9.0) |
48.5 ( 9.2) |
40.8 ( 4.9) |
33.6 ( 0.9) |
14.4 ( -9.8) |
9.0 (-12.8) |
29.9 (-1.2) |
| Precipitation inches (mm) |
1.95 (50) |
1.26 (32) |
0.86 (22) |
1.06 (27) |
1.63 (41) |
3.65 (93) |
1.56 (40) |
0.20 ( 5) |
0.83 (21) |
0.67 (17) |
2.22 (56) |
2.91 (74) |
18.80 (478) |
| Snowfall inches (cm) |
22.5 (57) |
9.8 (25) |
0.1 ( 0) |
1.9 ( 5) |
0.0 ( 0) |
0.0 ( 0) |
0.0 ( 0) |
0.0 ( 0) |
0.0 ( 0) |
0.1 ( 0) |
25.0 (64) |
21.0 (53) |
80.3 (204) |
| Snowy days (≥0.1 in.) (≥0.25 cm) |
6 | 7 | 0 | 2 | 0 | 0 | 0 | 0 | 0 | 0 | 12 | 12 | 3.3 |
| Average high °F (°C) | 36.5 ( 2.5) |
39.5 ( 4.2) |
49.1 ( 9.5) |
61.2 (16.2) |
81.3 (27.4) |
85.5 (29.7) |
95.1 (35.0) |
89.7 (32.0) |
77.0 (25.0) |
61.4 (16.3) |
39.9 ( 4.4) |
36.8 ( 2.7) |
62.9 (17.2) |
| Average low °F (°C) | 21.7 ( -5.7) |
16.8 ( -8.4) |
21.0 ( -6.1) |
28.5 ( -1.9) |
43.7 ( 6.5) |
43.9 ( 6.6) |
47.1 ( 8.4) |
49.2 ( 9.6) |
41.7 ( 5.4) |
32.7 ( 0.4) |
24.9 ( -3.9) |
27.0 ( -2.8) |
33.3 (-0.7) |
| Precipitation inches (mm) |
1.66 (42) |
0.61 (15) |
0.64 (16) |
2.20 (56) |
2.62 (67) |
1.12 (28) |
0.45 (11) |
2.58 (66) |
2.36 (60) |
0.38 (10) |
2.26 (57) |
2.25 (57) |
19.13 (486) |
| Snowfall inches (cm) |
5.4 (14) |
5.2 (13) |
3.6 ( 9) |
1.2 ( 3) |
0.0 ( 0) |
0.0 ( 0) |
0.0 ( 0) |
0.0 ( 0) |
0.0 ( 0) |
0.0 ( 0) |
2.0 ( 5) |
11.4 (29) |
28.8 (73) |
| Snowy days (≥0.1 in.) (≥0.25 cm) |
5 | 5 | 4 | 1 | 0 | 0 | 0 | 0 | 0 | 0 | 2 | 11 | 2.4 |
| Average high °F (°C) | 30.7 (-0.7) |
42.0 ( 5.5) |
52.8 (11.6) |
61.9 (16.6) |
|||||||||
| Average low °F (°C) | 17.4 ( -8.1) |
24.7 ( -4.1) |
23.8 ( -4.6) |
28.8 ( -1.8) |
|||||||||
| Precipitation inches (mm) |
2.54 (65) |
1.53 (39) |
1.43 (36) |
0.41 (10) |
|||||||||
| Snowfall inches (cm) |
17.5 (44) |
4.9 (12) |
2.1 ( 5) |
0.0 ( 0) |
|||||||||
| Snowy days (≥0.1 in.) (≥0.25 cm) |
11 | 4 | 2 | 0 | |||||||||
| Month | Jan | Feb | Mar | Apr | May | Jun | Jul | Aug | Sep | Oct | Nov | Dec | Year |
| Source: My records here 2002-2024 | |||||||||||||
Weather Charts for Lambert Creek, Republic, WA
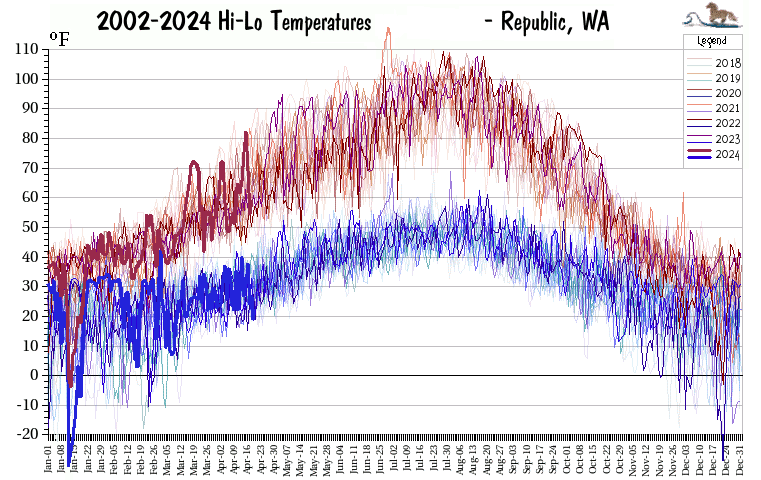 Daily Hi/Lo chart in progress
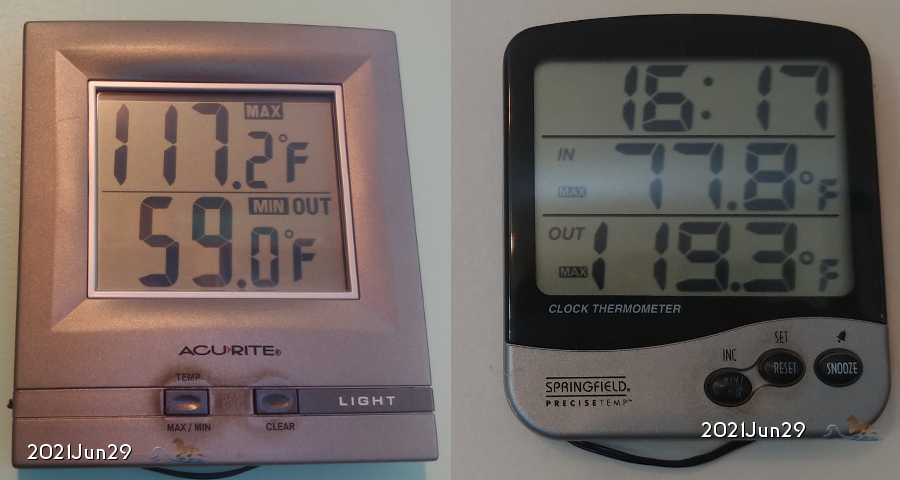 [enlarge]
 Ground temperature at 1 and 3 feet depth
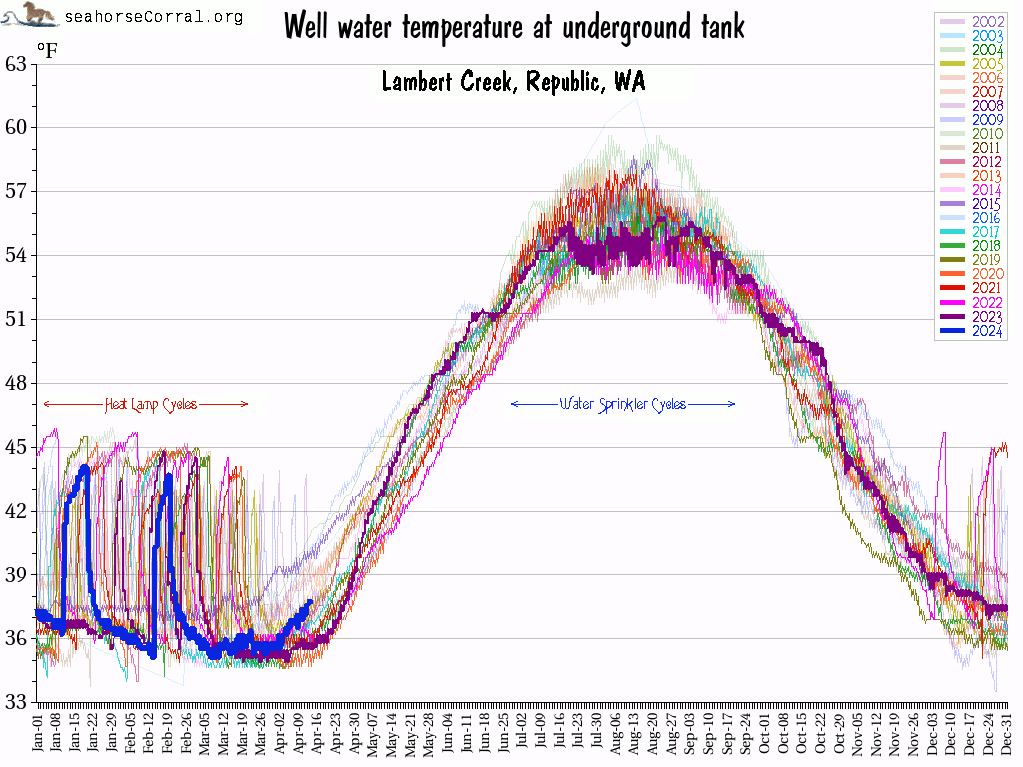 Well water temperature at underground tank
 Yearly Heat Units
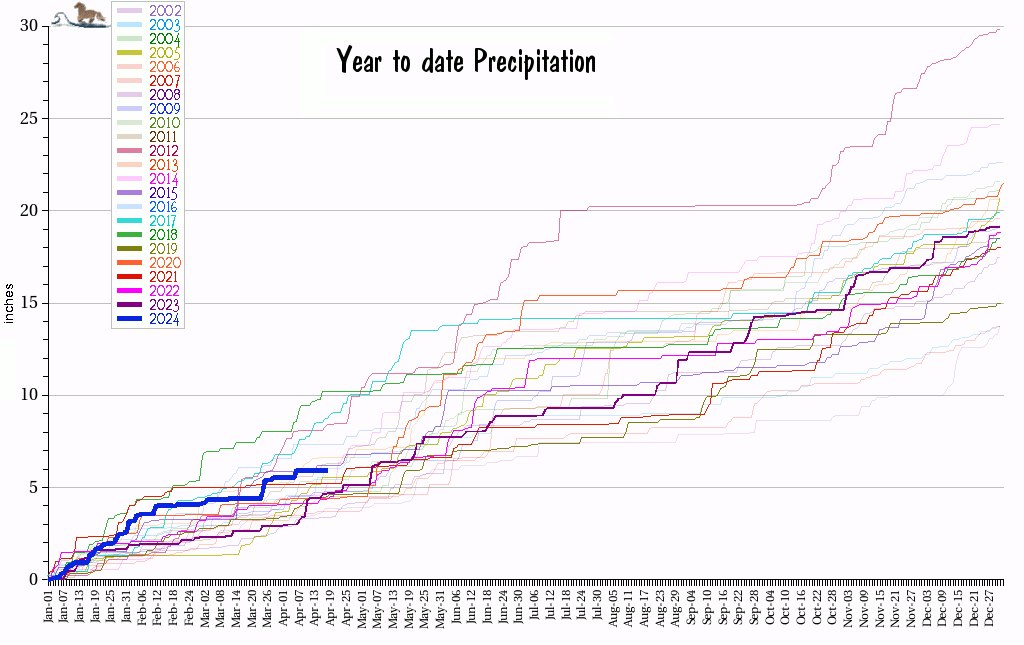 Yearly Accumulated liquid precipitation
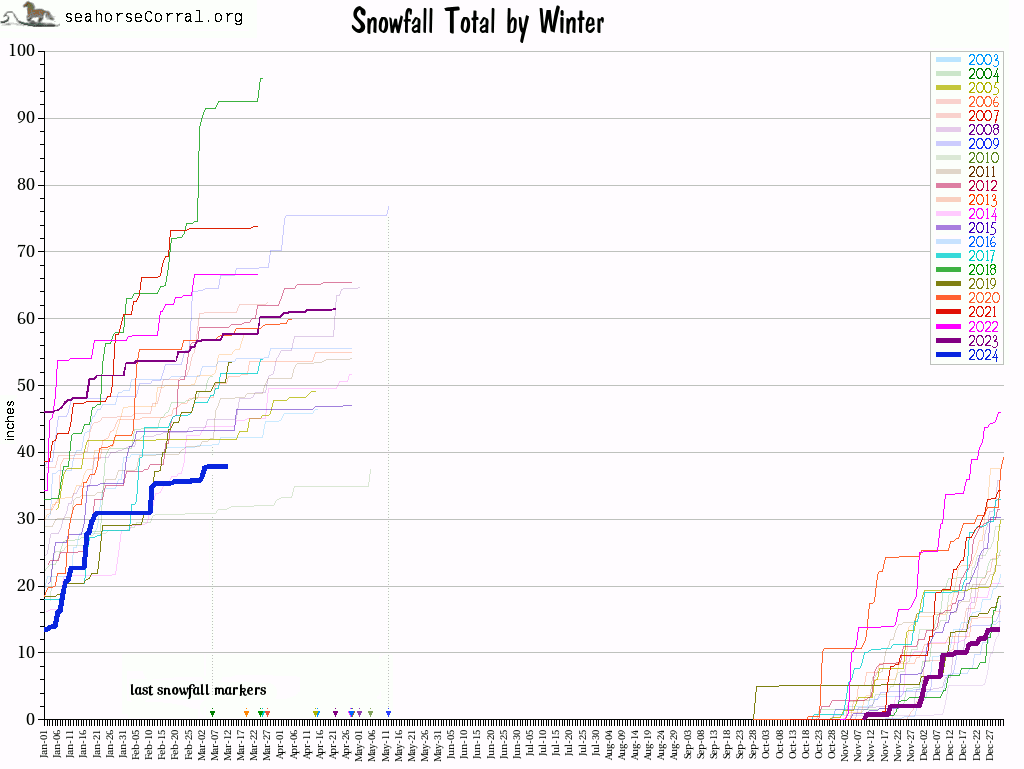 Yearly Accumulated Snowfall
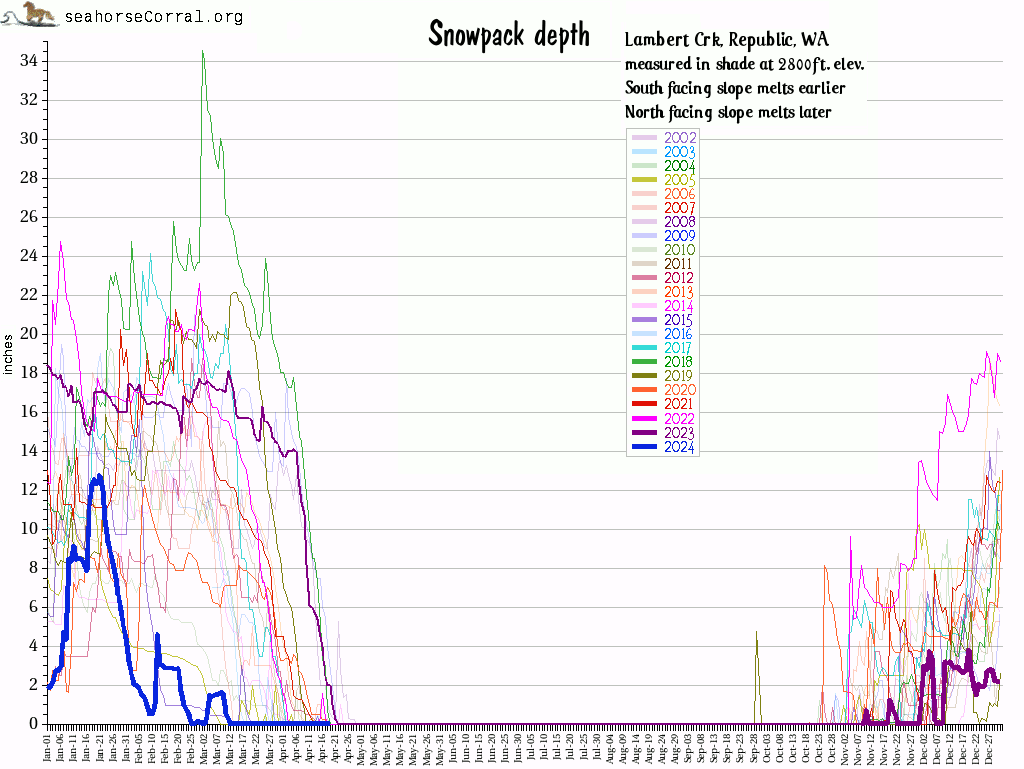 Snowpack depth
 Snowpack depth on the Kettle Crest at SNOWTEL site Sentinel Butte
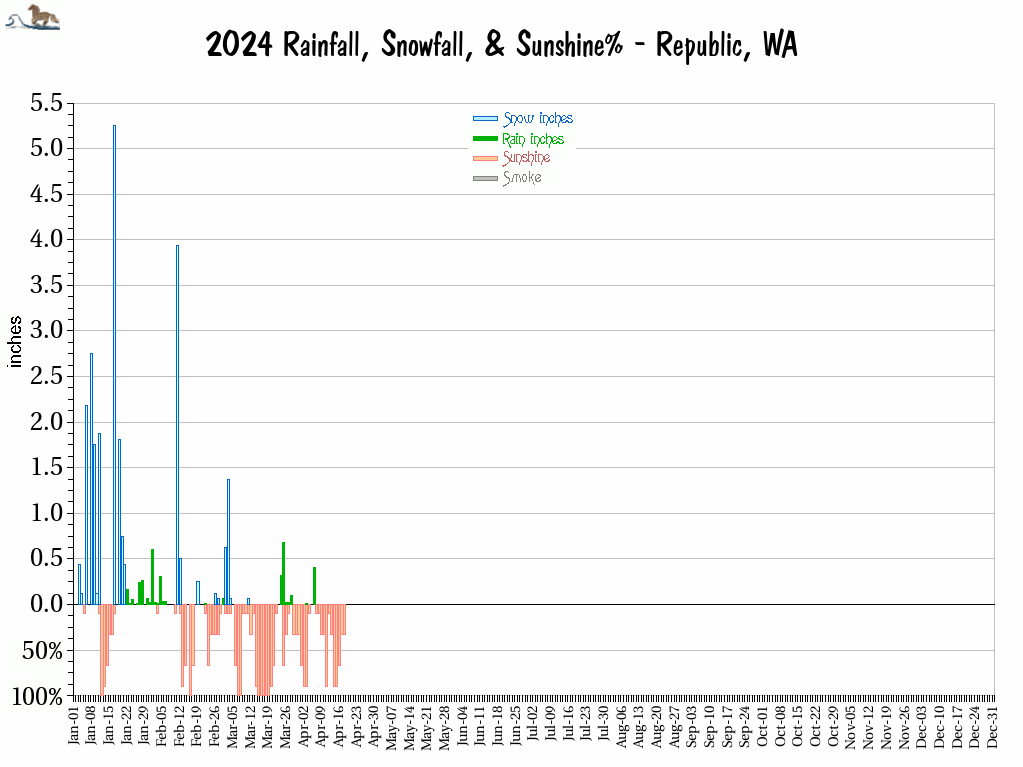 2024 Precipitation by type, sunshine percentage, cloud cover
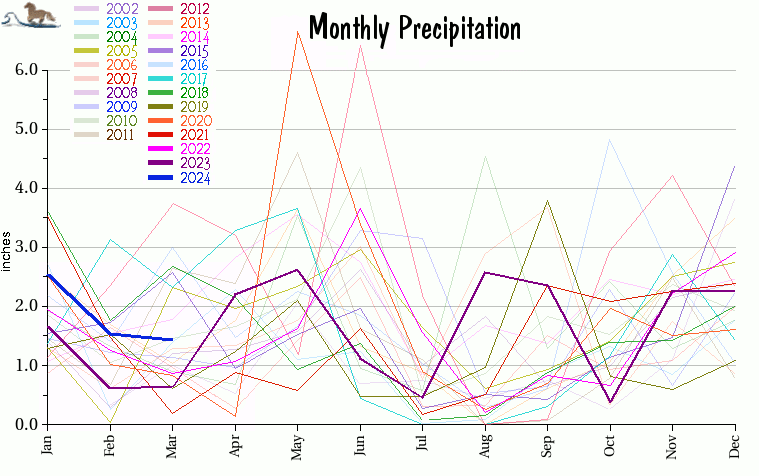 Monthly Precipitation
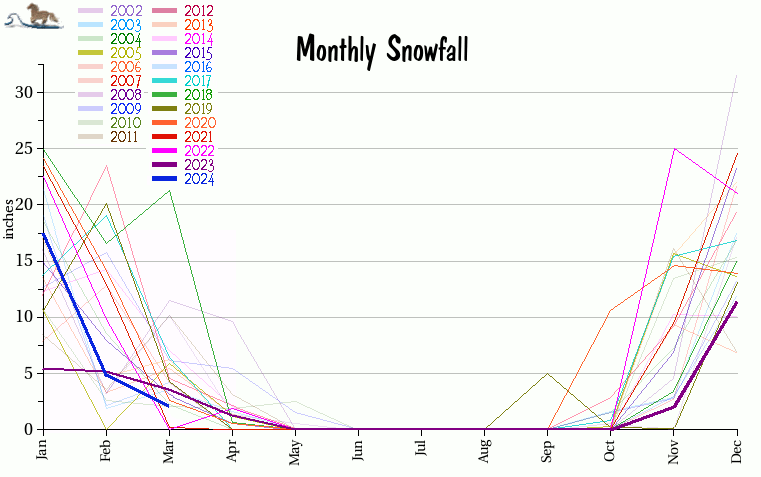 Monthly Snowfall
![[Home]](images/home.gif)
![[Republic photos]](images/20110501_S35SW_LambertMtn-CopperButte_SE_7215-t60.jpg)
![[e-Mail me]](images/mbicon.gif)